This is an old revision of the document!
# Debug Mode Quick Start Guide
The debug mode in Behavior Bricks is a set of features that allows to debug the execution of the `Behavior Executor` component attached to your entities. In debug mode you can:
- View in real time the execution flow of a behavior tree - Display the values of the blackboard parameters during execution - Pause and resume the execution of a behavior tree for an entity or group of entities - Set breakpoints in nodes of the behavior tree
## Debug mode and execution flow visualization
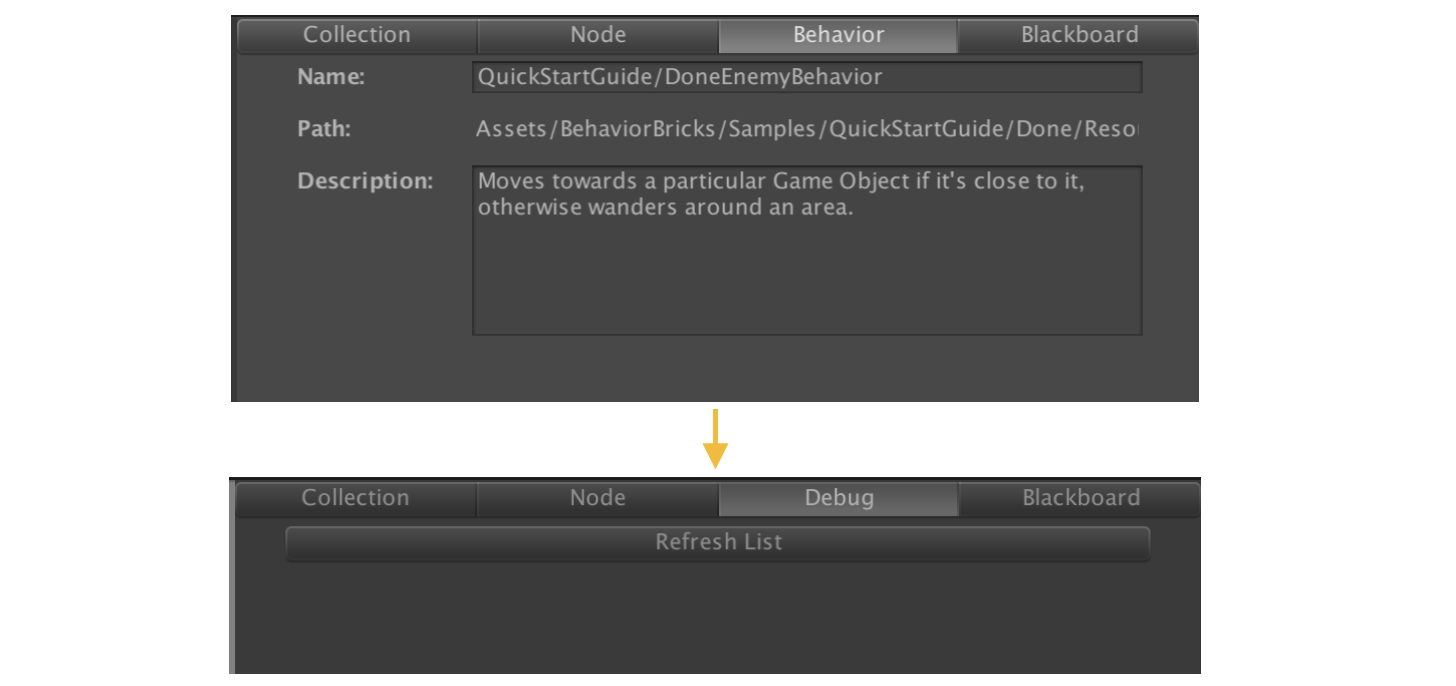
The Behavior Bricks editor enters debug mode automatically when playing a scene in the Unity editor, substituting the `Behavior` tab of the Behavior Bricks editor with the `Debug` tab, as shown in the Figure:
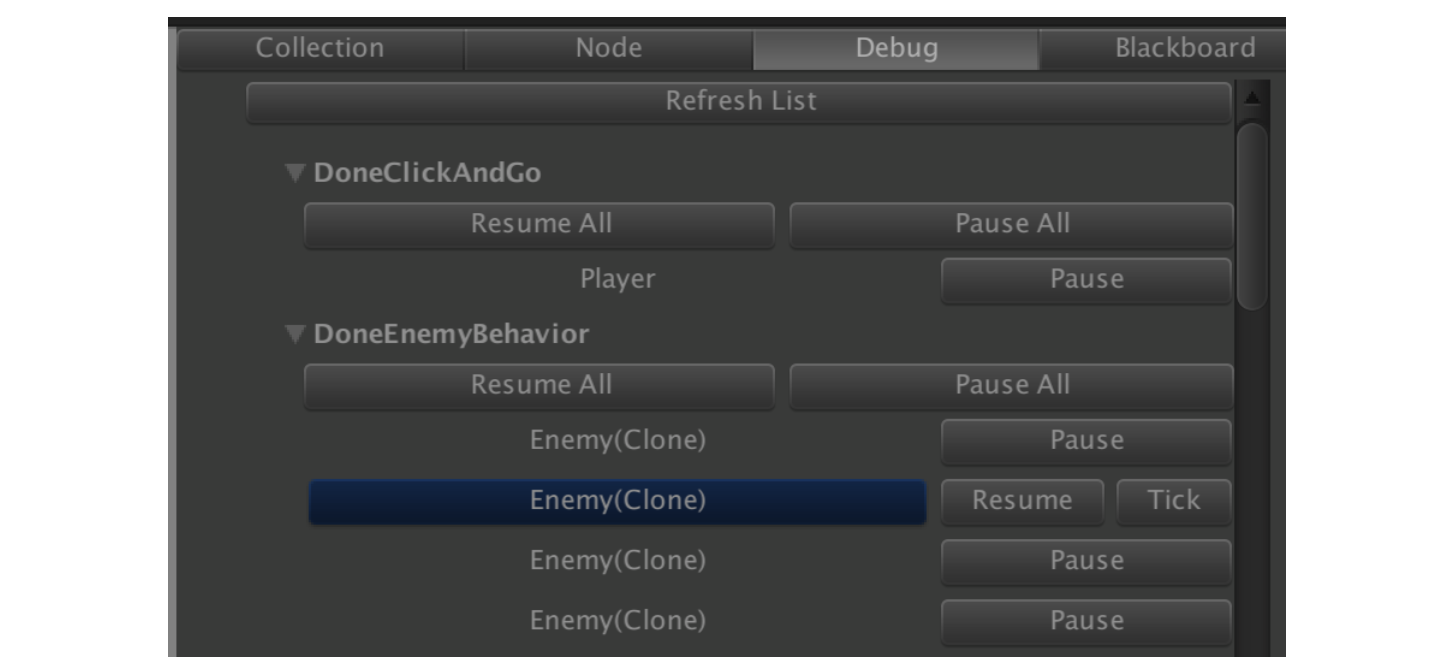
To watch the execution flow for a particular behavior tree of a given entity in the scene, you must open the behavior tree in the Behavior Bricks editor, and select the entity to debug in the Unity´s `Hierarchy` panel. Alternatively, the entity can be selected in the `Debug` tab, by first clicking on the `Refresh List` button and then clicking on the entity name. The `Debug` tab shows a list of the entities in the scene being played which contain a `Behavior Executor` component, grouped by the behavior assigned, as shown in the Figure:
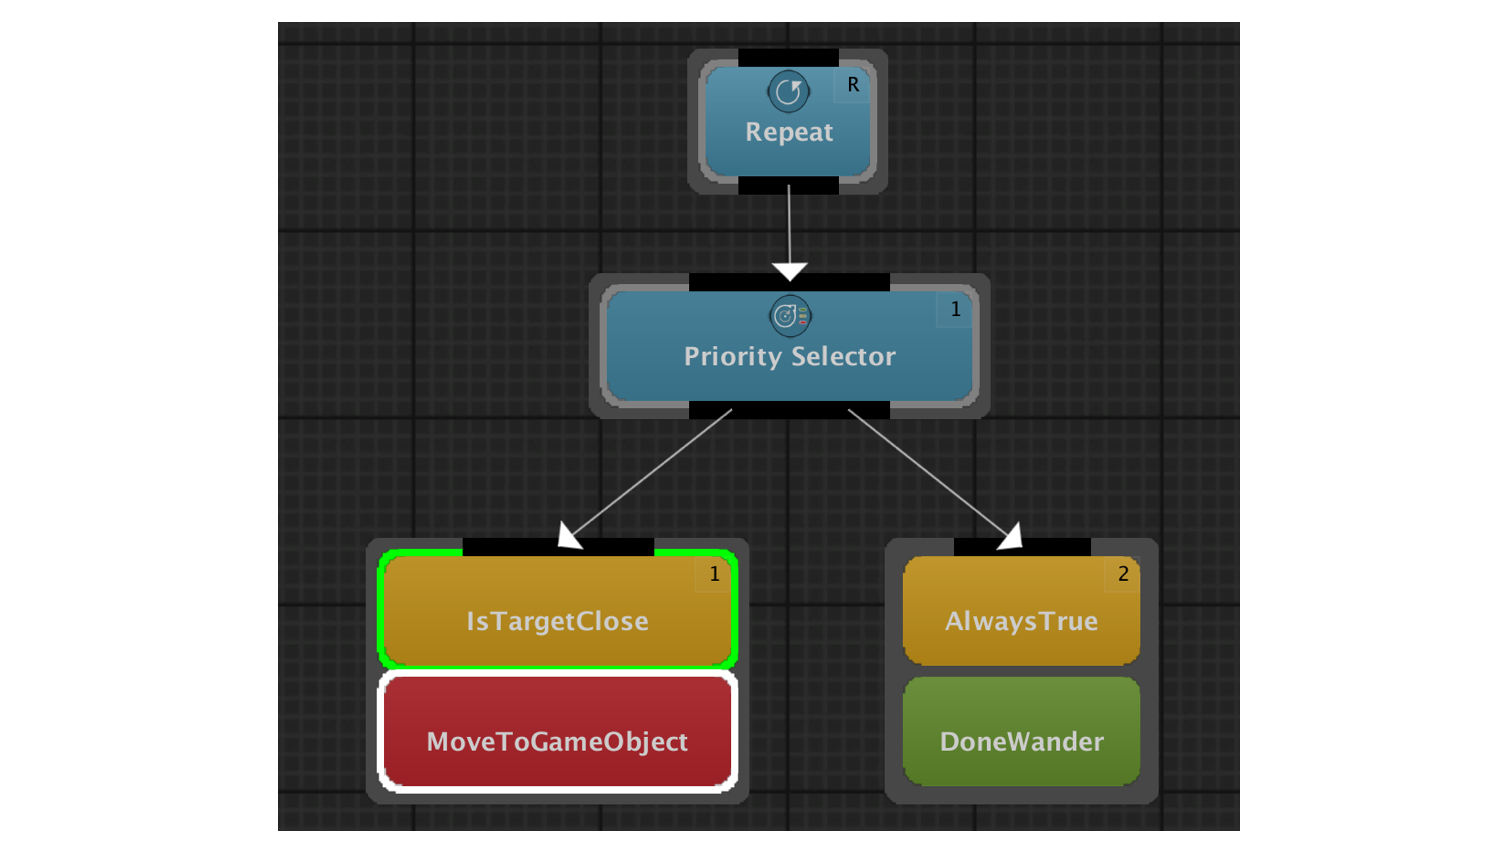
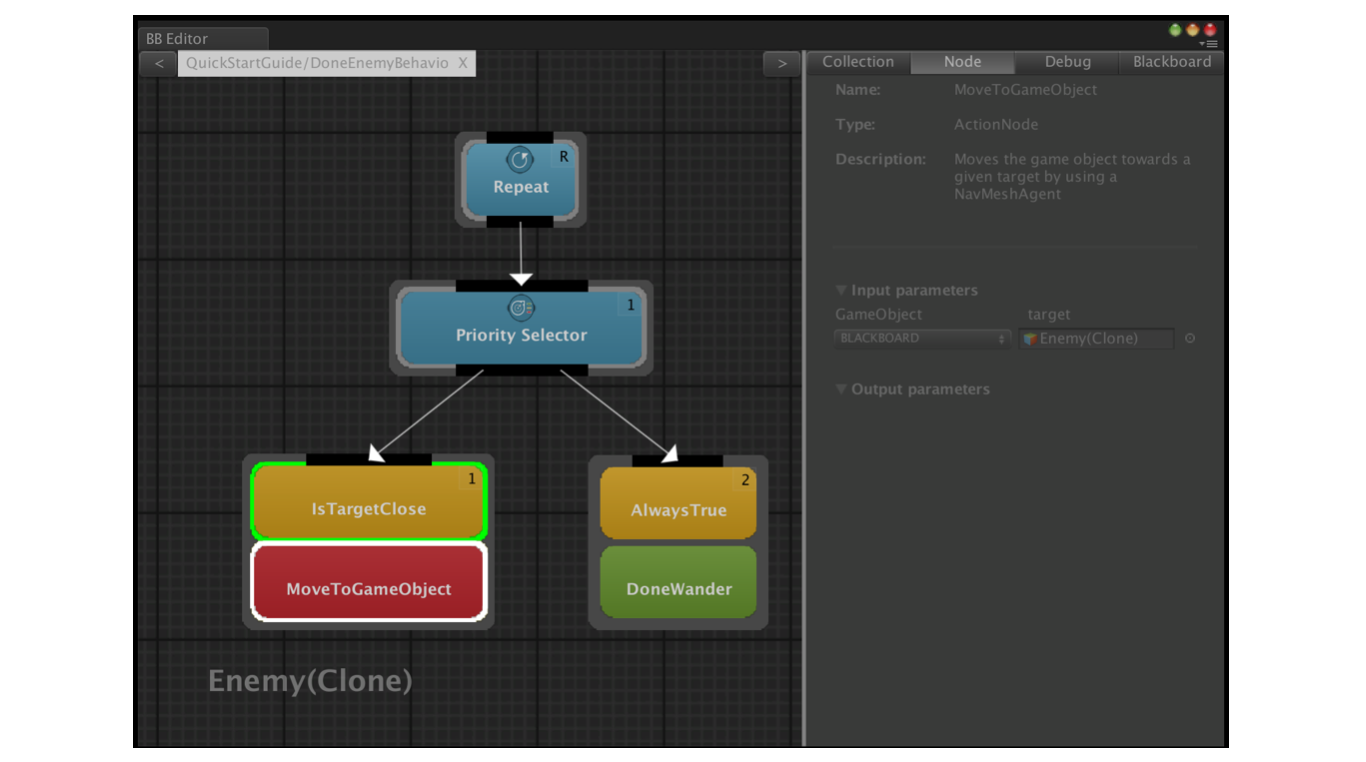
Once the behavior and the entity have been selected, the state of each node is depicted by changing the color of its bounding box:
- White while running (`MoveToGameObject` in the Figure) - Green when finished returning `Completed` (`IsTargetClose` in the Figure) - Red when finished returning `Failed` - Grey when in suspended state (`Repeat` and `Priority Selector` in the Figure)
From the `Debug` tab is also possible to pause the execution of an entity behavior by clicking on the `Pause` button next to the entity name. Keep in mind that the pause will start after it finishes its current task. Once you have pressed the pause button you can either `Resume` the behavior or `Tick` it so the behavior receives one update call and then return to pause.
It is also possible to pause and resume all the entities that use a given behavior by pressing the corresponding `Resume all` or `Pause all` button.
## Watches and breakpoints
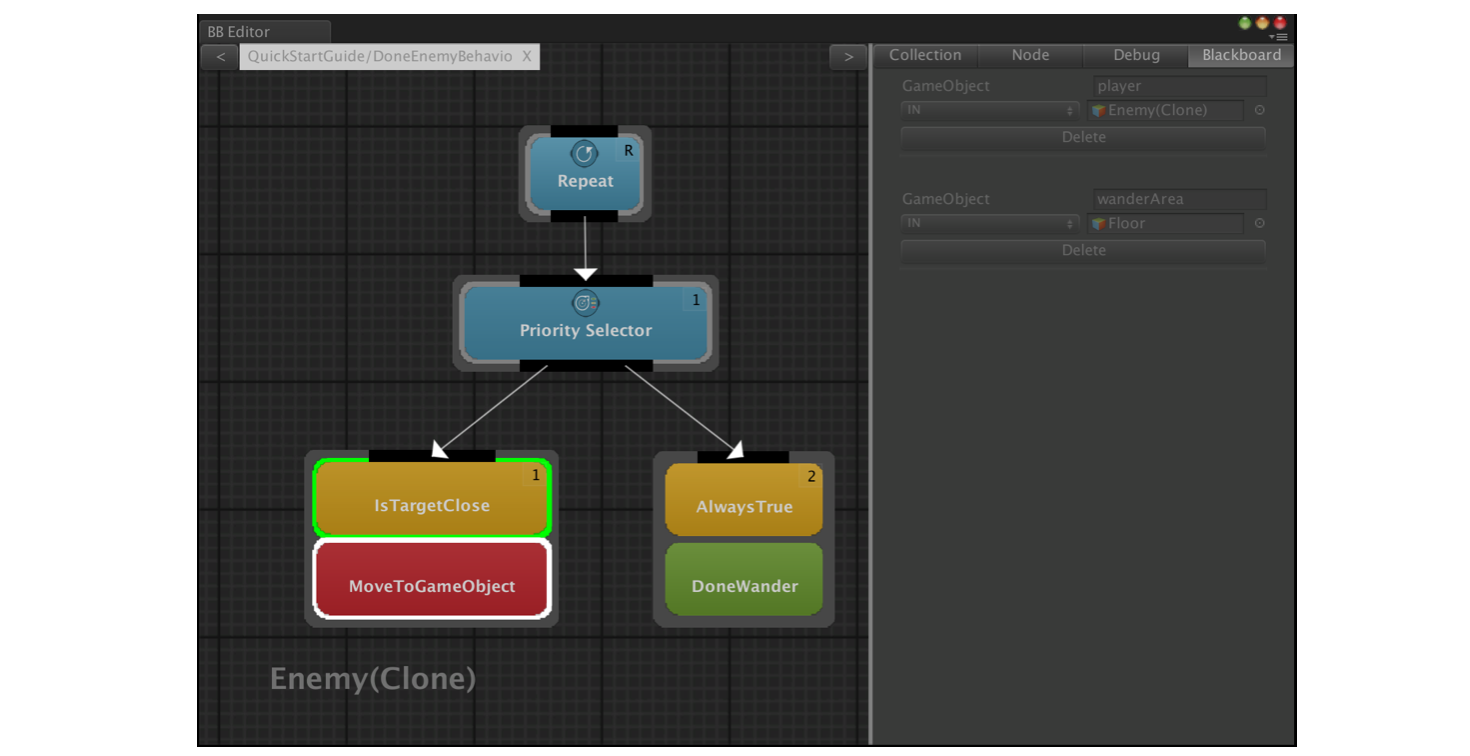
While in debug mode it is possible to inspect the value of the parameters of a running tree or the parameters of a particular node in a running tree. The `Blackboard` tab shows the parameters of the selected tree in a given entity (previously selected in the `Debug` tab):
and for a running tree, by clicking on one of its node it is possible to inspect the node parameters:
With this feature you can pause the execution of the game when a node for a concrete behavior tree of a specific entity reach one of the following states:
- Success - Failed - Aborted - Launched
To add a breakpoint you just need to right click in a node and select `Add Breakpoint`:

You can configure what events the breakpoint should be triggered in the `Node` tab by marking the desired events.

In case all events are unmarked the breakpoint will be displayed as disabled with a grey color:

Remeber that a breakpoint can only be triggered when:
- You are on Play Mode - Behavior Bricks Editor is open - A valid entity is selected - The behavior that contains the node with the breakpoint attached is open, but you don´t need the behavior to be the active tab.

