Debug Mode Quick Start Guide
The debug mode in Behavior Bricks is a set of features that allows to debug the execution of the Behavior Executor component attached to your entities. In debug mode you can:
- View in real time the execution flow of a behavior tree
- Display the values of the blackboard parameters during execution
- Pause and resume the execution of a behavior tree for an entity or group of entities
- Set breakpoints in nodes of the behavior tree
Debug mode and execution flow visualization
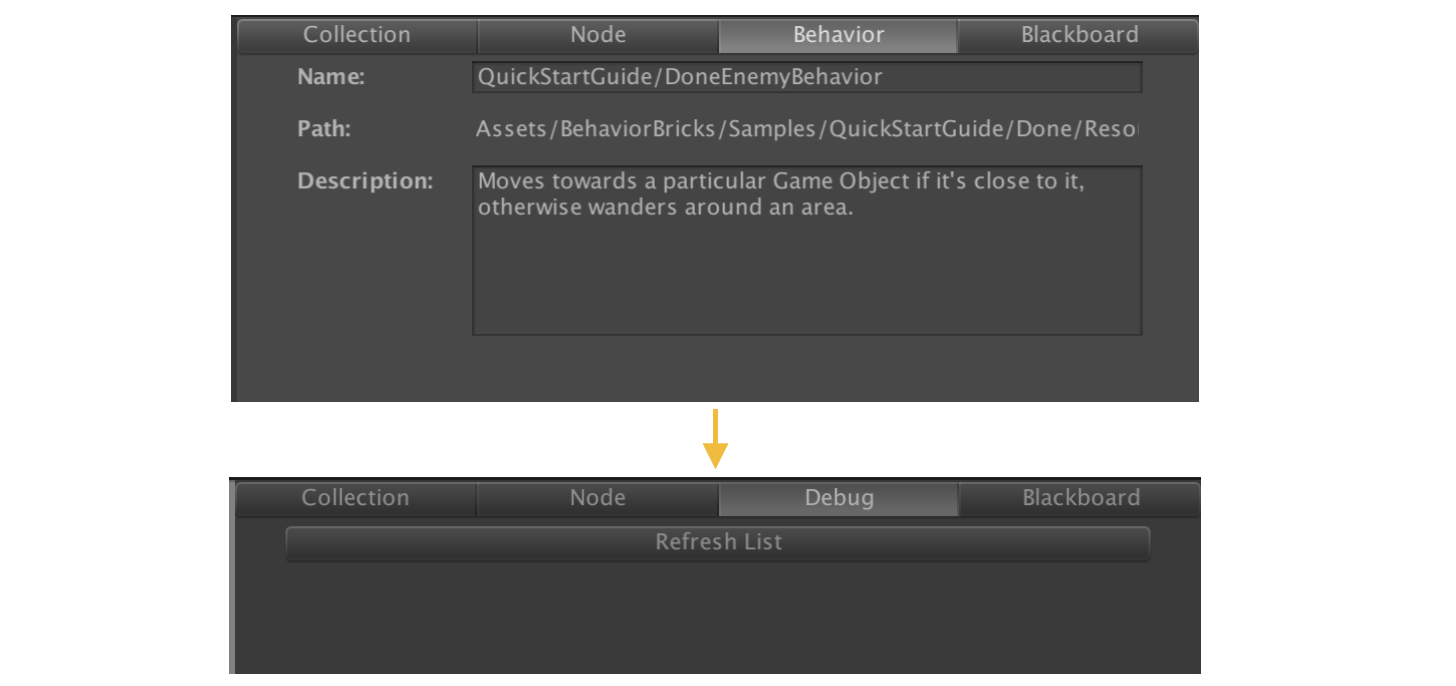
The Behavior Bricks editor enters debug mode automatically when playing a scene in the Unity editor, substituting the Behavior tab of the Behavior Bricks editor with the Debug tab, as shown in the Figure:
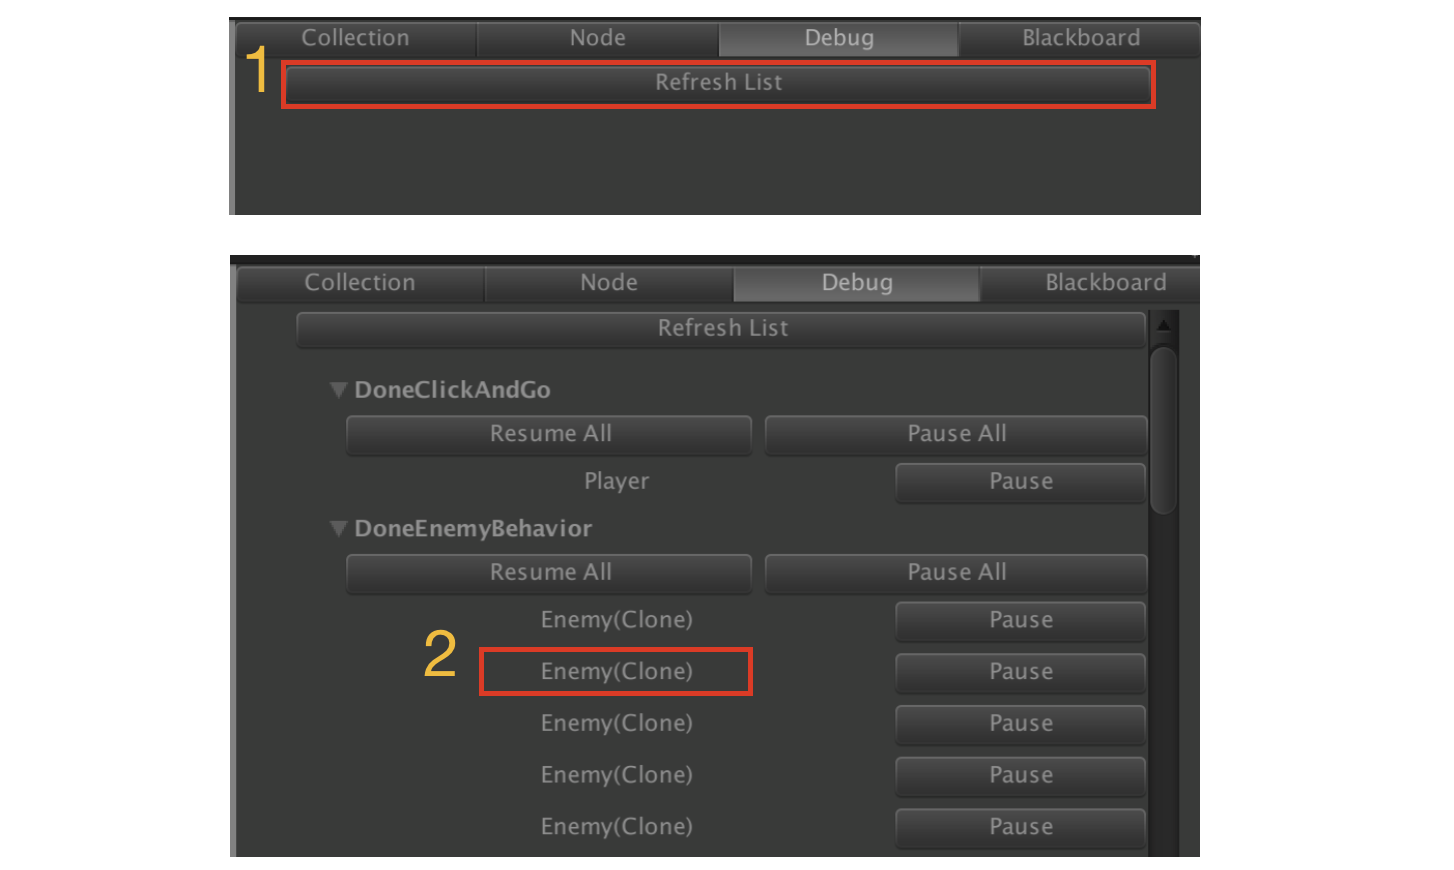
To watch the execution flow for a particular behavior tree of a given entity in the scene, you must open the behavior tree in the Behavior Bricks editor, and select the entity to debug in the Unity´s Hierarchy panel. Alternatively, the entity can be selected in the Debug tab, by first clicking on the Refresh List button and then clicking on the entity name. The Debug tab shows a list of the entities in the scene being played which contain a Behavior Executor component, grouped by the behavior assigned, as shown in the Figure:
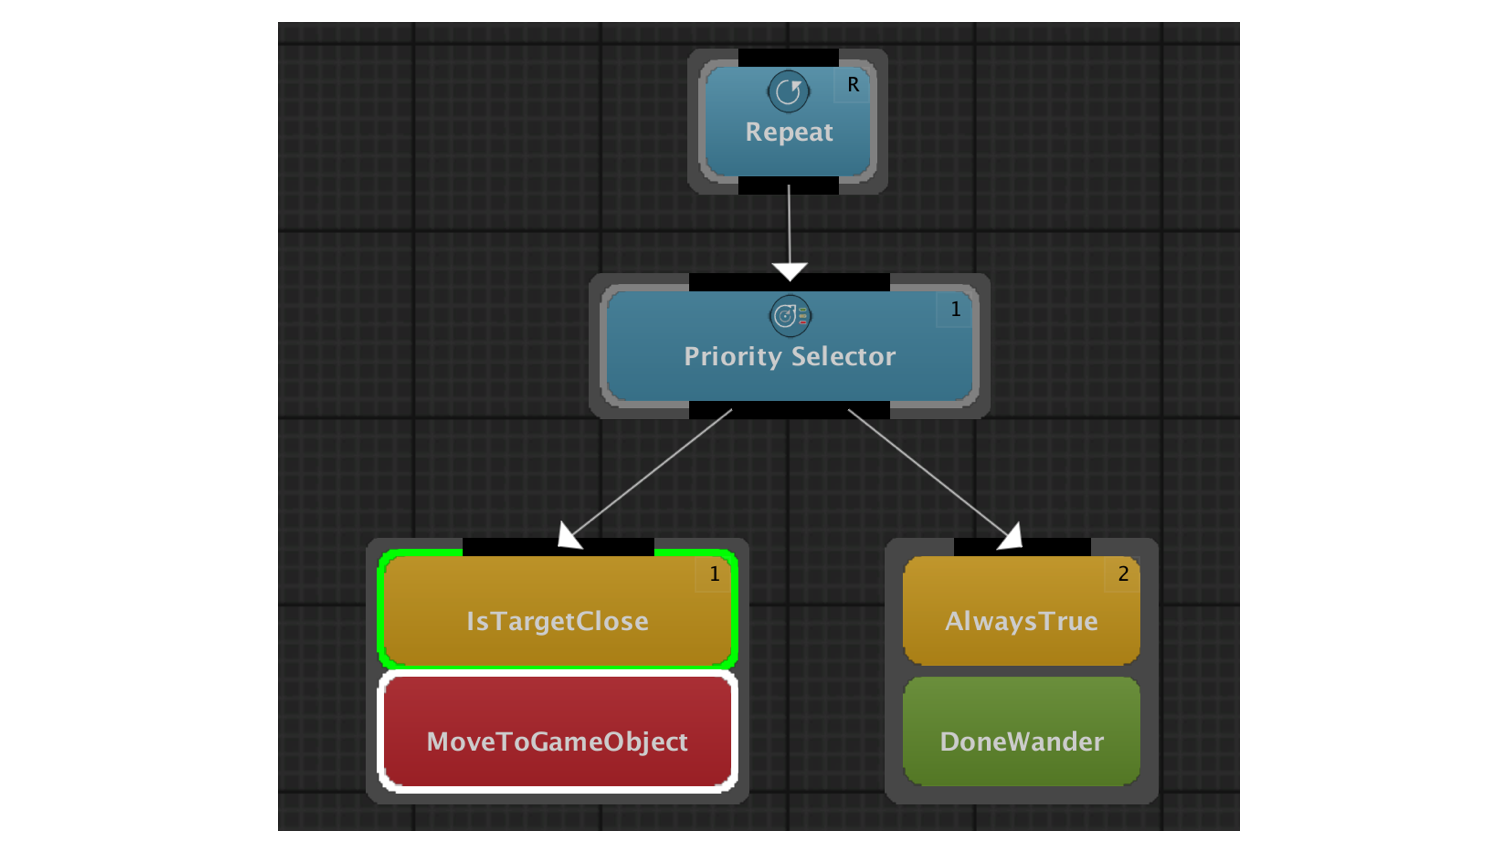
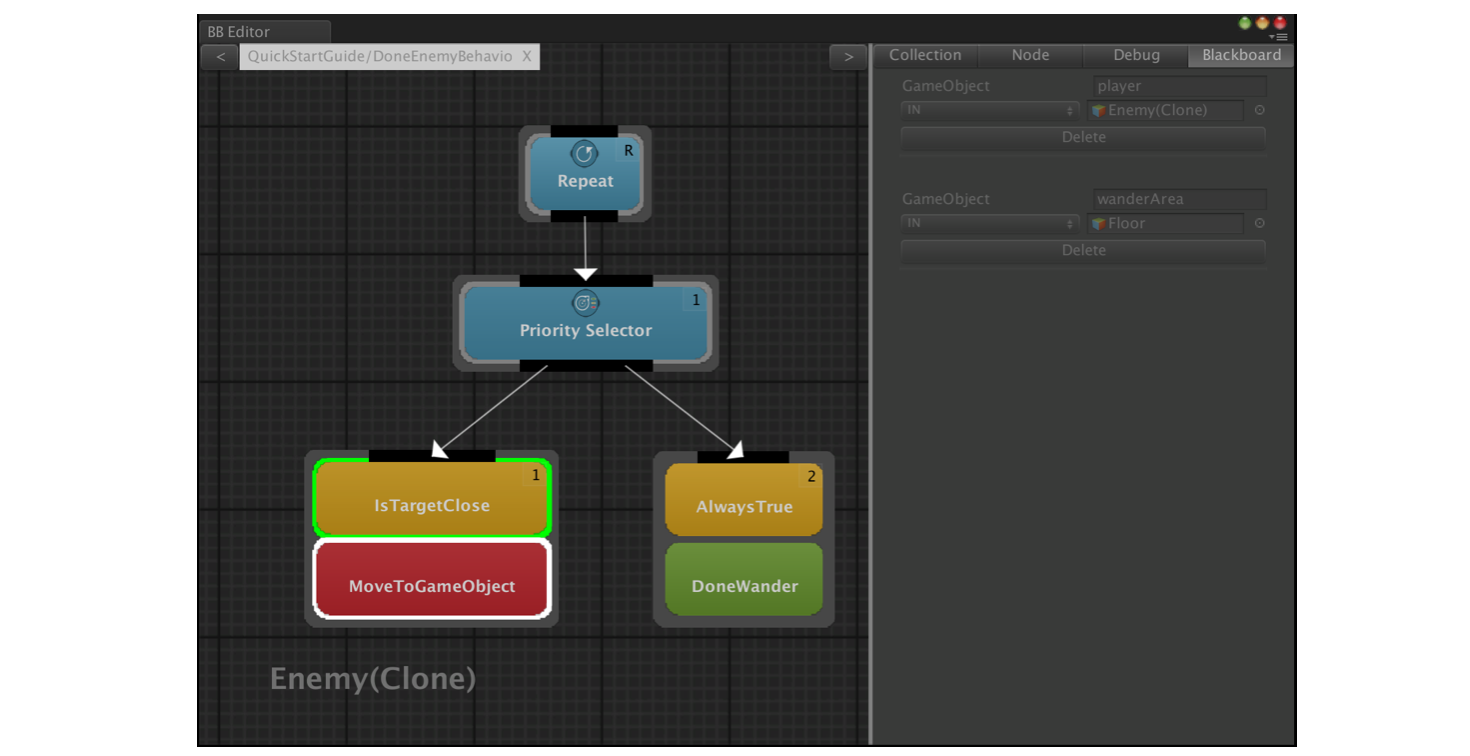
Once the behavior and the entity have been selected, the state of each node is depicted by changing the color of its bounding box:
- White while running (
MoveToGameObjectin the Figure) - Green when finished returning
Completed(IsTargetClosein the Figure) - Red when finished returning
Failed - Grey when in suspended state (
RepeatandPriority Selectorin the Figure)
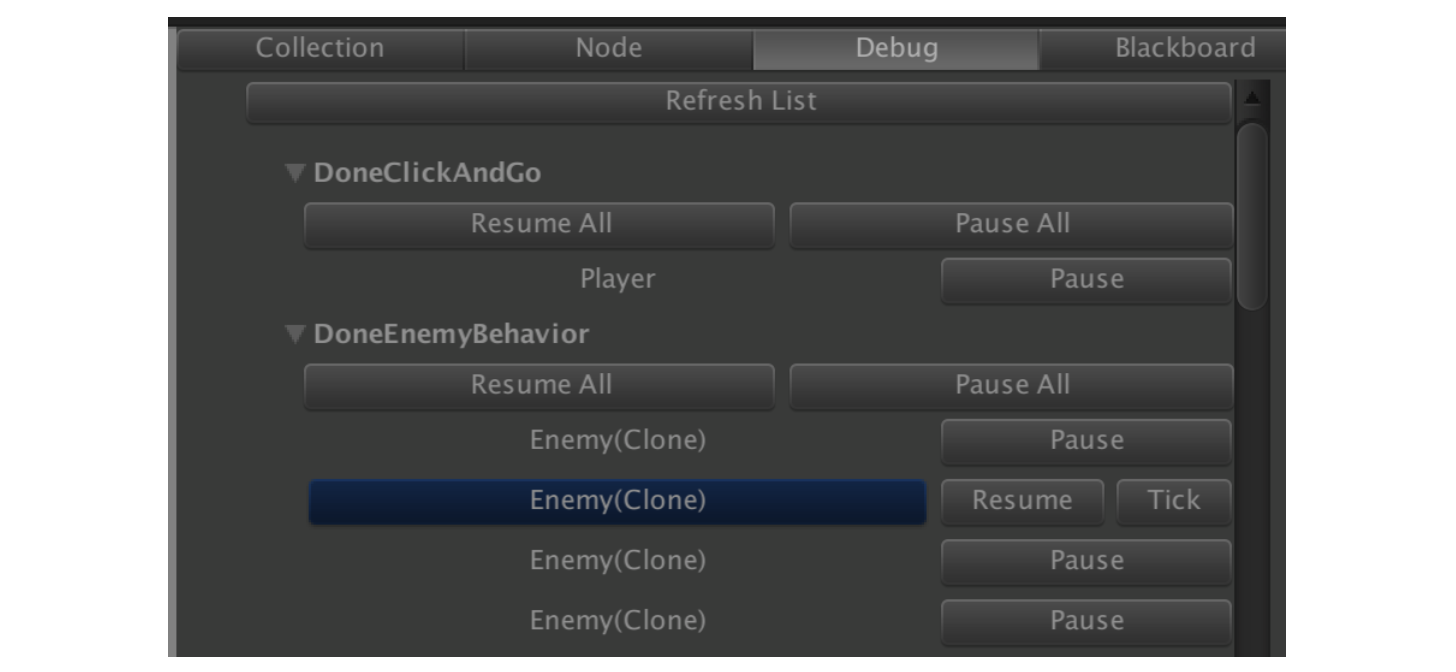
From the Debug tab is also possible to pause the execution of an entity behavior by clicking on the Pause button next to the entity name. Keep in mind that the pause will start after it finishes its current task. Once you have pressed the pause button you can either Resume the behavior or Tick it so the behavior receives one update call and then return to pause.
It is also possible to pause and resume all the entities that use a given behavior by pressing the corresponding Resume all or Pause all button.
Watches and breakpoints
While in debug mode it is possible to inspect the value of the parameters of a running tree or the parameters of a particular node in a running tree. The Blackboard tab shows the parameters of the selected tree in a given entity (previously selected in the Debug tab):
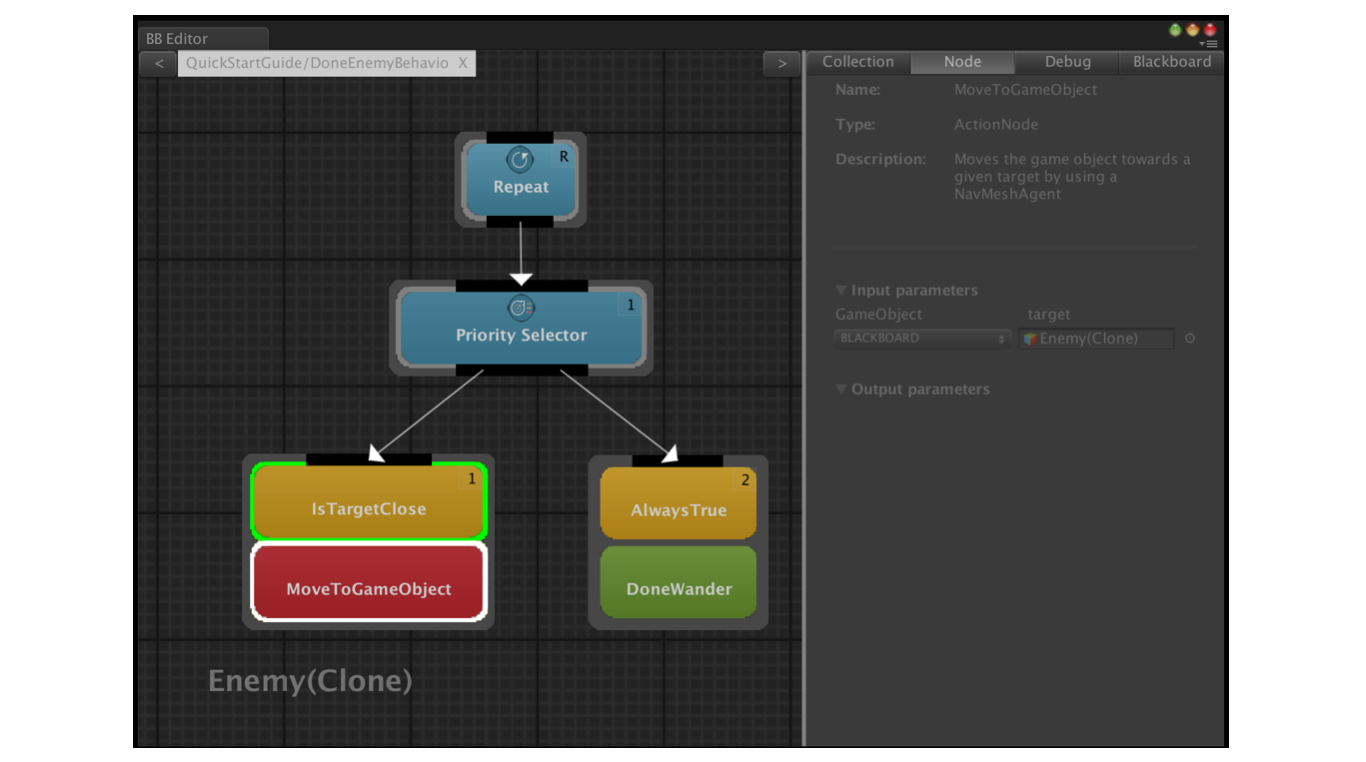
and for a running tree, by clicking on one of its node it is possible to inspect the node parameters:
Breakpoints
Behavior Bricks also features a simple type of breakpoint that allows to pause the execution of the scene whenever a given condition is reached in a particular node of a behavior tree in a given entity.
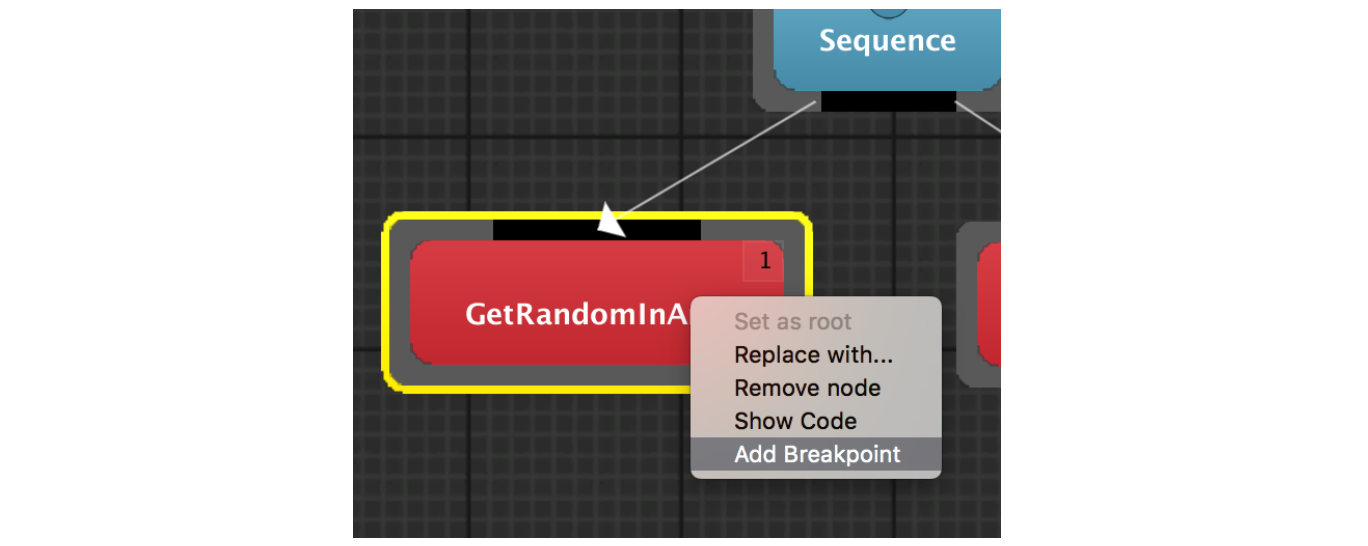
In order to set a breakpoint you just need to right click in a node and select Add Breakpoint, and this can be done while in edit or play mode of the Unity editor:
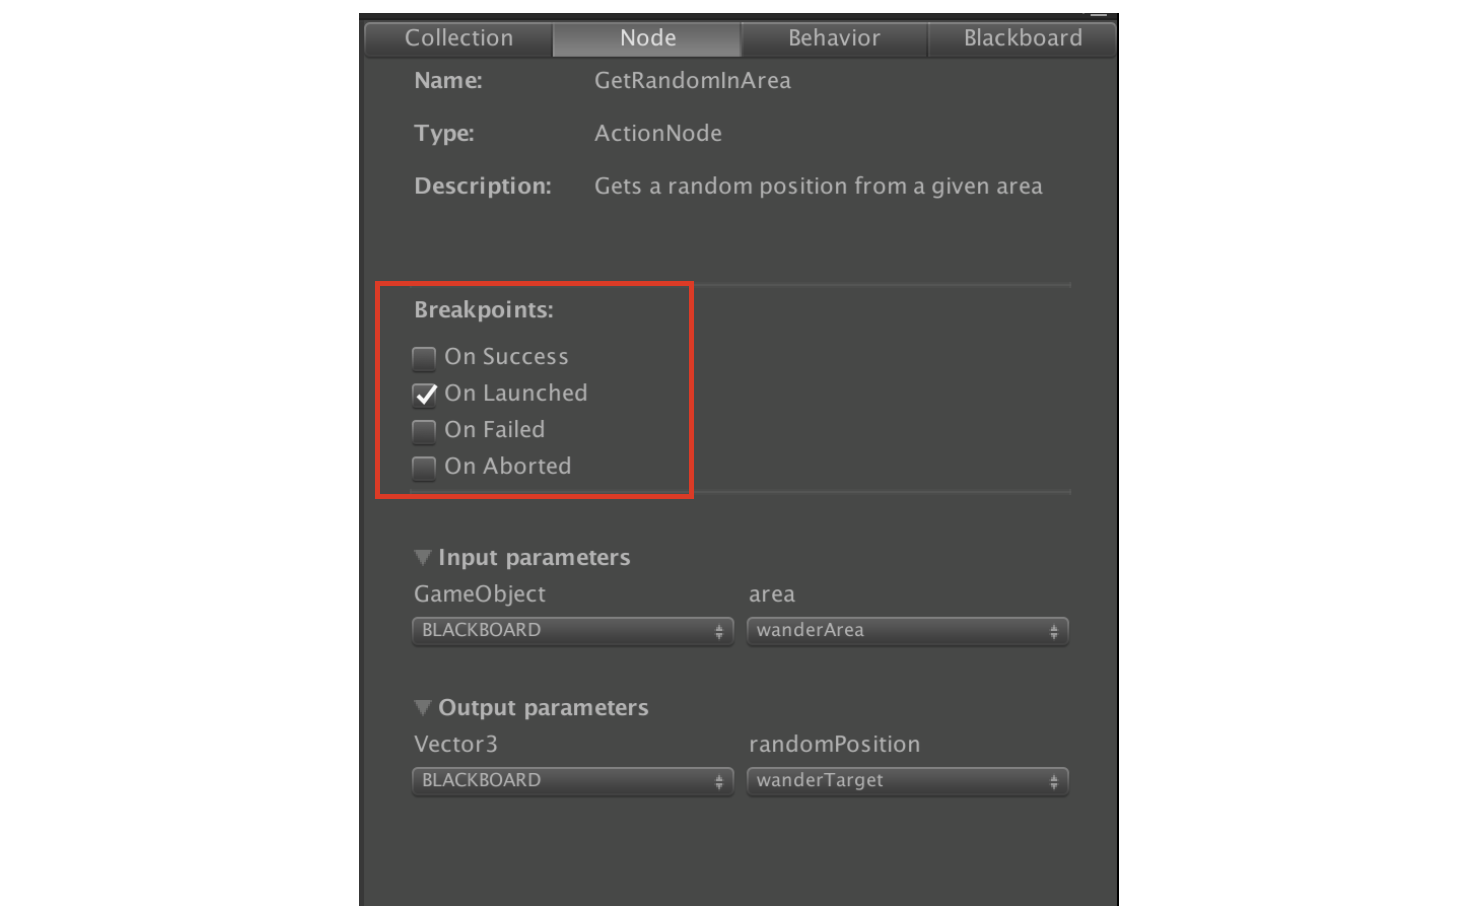
Then, in the Node tab, it is possible to select the event(s) triggered by the node that will make the breakpoint to have effect:
Finally, for the breakpoint to have effect, the scene has to be played, an entity containing the tree with the breakpoint has to be selected in the Debug tab, and the behavior tree has to be opened in the Behavior Bricks editor (it is not required it to be in the active tab of the editor). When the breakpoint is reached, the execution of the scene will be paused.
A node with a breakpoint may be in three possible states: inactive with some event selected (left), inactive with none event selected (middle), active (right)
